How to Create Infographics for Emails DIY guide for Non-Designer
If you are not a graphic designer, you can also create attractive and innovative marketing user infographics for your website and social media. From the last few years, we all have observed that many informative and creative graphics have taken up all over the web. The infographics widely spread worldwide are so heavy or complicated that it cannot be told in a long text. Infographics are very useful to communicate a message or a subject with the help of the following illustrate topics.
- Charts
- Graphics
- Images
- A short bit of text and so on
- Understand complex information:Infographics are used to present a long story in short form. It frees our brain from the cluster of data. It allows your brain to grab the important points for perception.
- Increase brand awareness:The brand name, logo, and website URL are placed on an infographic linked with the content that you have created for your brand. It also helps your company to get recognized by your customers in the future.
- Take your content viral:Content with images becomes so viral. 94% of people prefer the content with images. There are more views on the range with photos than content without, making infographics so popular.
- Boost traffic:It is very easy to share infographics. The more people share your content, the higher you will attain open rates on each click and open. Infographics help to engage more people.
Studies have shown that human brains can grab visual information faster than words. Visual communication has a great impact on the brain. It will be more significant as well as long-lasting. As the world is moving towards development, so the demands of attention are increasing rapidly. It is the ever-changing of our lives. To communicate your message effectively, you have to do it fast. For this purpose, infographics are the best to convey a message. In the past, human beings present information graphically. They scratch it on the cave walls. But moving fast forward from the ’80s to ’90s, the best and innovative form of giving information graphically using newspaper like USA Today and Britain’s Sunday Times. At that time, this is the best way of using infographics, through which the world is presenting the information graphically. Nowadays, the web has become the most communication method, that’s why they use infographics has burst up. You can see infographics on different types of topics, especially check your Pinterest and Instagram feed to find a variety of infographics. These are the modern way to present your information. Let’s discuss how even non-designers can create highly successful infographics.
What are infographics?
Infographics are the visual representation of information that presents highly complicated data very quickly and clearly in graphic illustration. You can present information graphically using pictures, icons, charts, schemes, diagrams, maps, and so on.
The advantages of using infographics in email marketing
It is a fact that the average human attention span is only eight seconds. One second is shorter than that of a goldfish. Studies showed that human beings perceive 90% of the information presented in pictures and diagrams. The information you shared should eye-catching enough to grab the attention of your users. Infographics can do this all. 41.5% of marketers believe that the information presented graphically is the best way to communicate clearly and easily. This type of content will help you to engage your users.
Other benefits of Infographics
Although infographics are the best of catching attention, it also helps to:
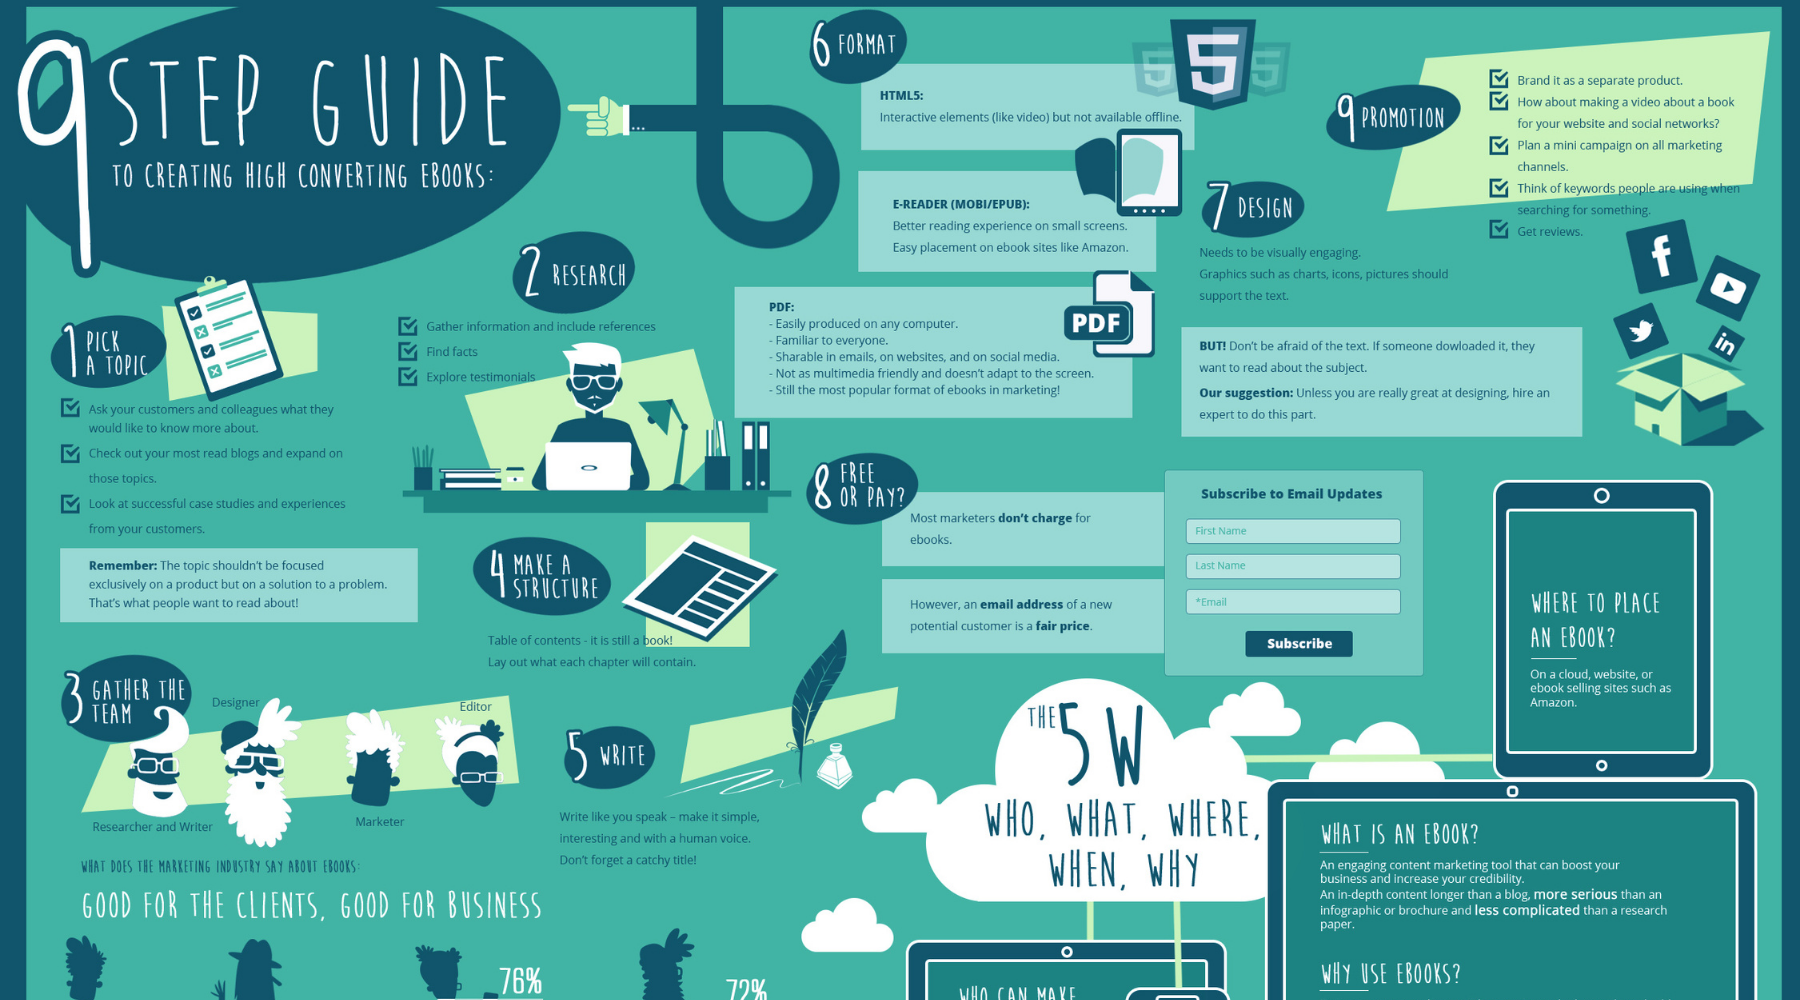
How to make infographics?
Step 1. Choose your target audience
It does not matter how cool is your infographic design. If you are presenting it in front of the wrong people, it will demolish your structure. While creating your infographics, think about the people who will read them: youngsters, marketers, male or female users.
Step 2. Define the content
Once you have selected your targeted audience, decide which sort of content you will share with them. For this, think about three to five questions that your infographics have to answer, then study the topic and collect information, then put it into groups to make sense.
Step 3. Get visual
Select in which form you will present the data: in charts, graphs, images, colorful text, maps, and so on. Then, design the infographic layout.
Colors: Select full five colors, including black and white color. Make sure that your selected colors have a combination with each other. Use different colors for the titles and content of the email.
Background:Select a simple background that matched your color selection.
Fonts: Use only one font size. Bold or Italic the titles or subtitles so that your text will be easier to read.
Graphic elements:Graphics likecharts, graphs, images, and icons have to be re-created with the color scheme without overloading the overall view.
Step 4. Customize
To boost conversion and the sharing of your content, add your logo and links to the videos. As you know, big files might fail to be shared online, so make your infographics under 2MB and save it in JPEG or PNG format.
Online infographics tools for nondesigners
Following are the online infographics tools:
Infogram:Here are different packages like $19 for a month, $16 for business, $149 for Team using, and negotiable pricing for an Enterprise plan. You can upgrade your pricing plan, you’ll get access to a wider range of templates, customization, and analytics options.
Canva:Different packages for canvass are: Free for a Basic plan, $12.95 a month for a Work plan, negotiable pricing for an Enterprise plan. By upgrading the pricing plan, you will get access to 400.000 free photos, illustrations, and templates. This will help you to customize your design and organize your working space.